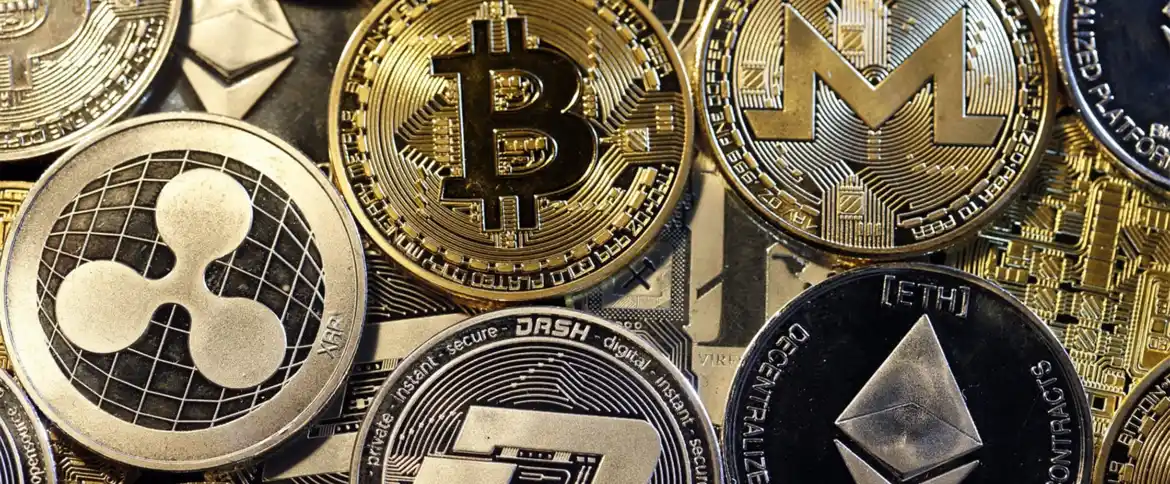
There is a lot of analytical information about cryptocurrency and blockchain technology on the Internet. We are used to seeing dry charts, charts that reflect the prices and capitalization of digital currencies. Fortunately, in addition to such informational materials, there are visual sites where we can visually see how all transactions take place and blocks are formed. In this material, you can see six cryptocurrency monitoring sites with a visualisation of all changes in the network.
Visualisation of cryptocurrencies on Coin360.com
This web site shows the relationship between different cryptocurrencies in terms of their capitalization and trading volume. Each coin has the appearance of a square or rectangle. The larger the figure, the greater the capitalization and volume of the currency. Also here are the rates of cryptocurrencies as well.
Visualisation of Bitcoin on Bitbonkers
The resource contains 3D graphics: bitcoin blocks and transactions in the form of figures fall from the sky. The squares symbolise new blocks mined every 10 minutes, and the balls symbolise transactions in the bitcoin blockchain. The balls differ in colour and size, which depends on the size of the transaction. You can click on each transaction to see the exact amount in bitcoins.
Blocks.wizb.it
A real bitcoin globe rotates, showing the location where the last block was mined and transactions with bitcoins took place. Information is updated in real time every fraction of a second. The main thing is not to look too long, otherwise you will start feeling dizzy.
Bitlisten.com
Here you can not only see the blockchain, but also hear it. Transactions are indicated in the form of bubbles that burst, creating a unique sound similar to the clink of crystal glasses.
Bitnodes
On a rotating 3D map, you can see all the available bitcoin nodes, select the one you need and see all the necessary information about it.
Mapofcoins.com
This site presents a map of cryptocurrencies in an unusual format in the form of a tree. Select, for example, the BTC branch and see all the cryptocurrencies copied from the bitcoin protocol.
Two rates of 10% per year can yield different returns, and the difference can sometimes become hundreds of dollars per position. It all comes down to the three letters before the percentage. APR and APY are being used at every turn in the cryptocurrency space: exchanges advertise APY rates on DeFi platforms, lending services display APR on loans, and the numbers next to these abbreviations look similar, even though they mean different things.
It’s important for investors to understand the difference between APR and APY, if only because platform marketers understand it perfectly well and always highlight whichever metric looks more attractive. So let’s break down what APR and APY are, provide the formulas, calculate examples using real numbers, and show where each metric is appropriate.
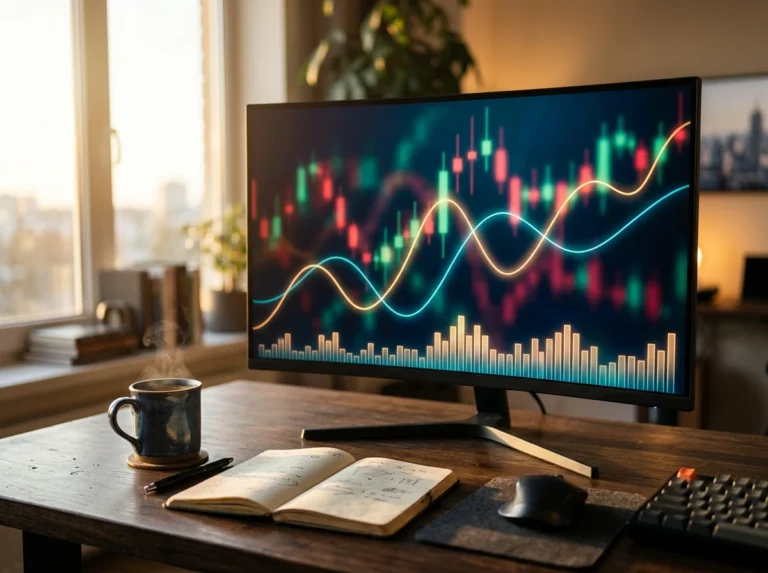
Open the chart for any cryptocurrency on an exchange or in TradingView, and you’ll almost certainly see the MACD among the built-in tools. It’s one of the most recognizable elements of technical analysis: it’s used by both beginners who are just getting started with crypto trading and professional fund managers. The reason is simple. The […]
BONK experienced a hard fall in May 2026. The current price is around $0.000004594, about 92% below the ATH (all-time high) of $0.00005898 set on November 20, 2024. The token still attracts a lot of attention, mostly because it is at the center of Solana’s meme economy. So, which BONK price forecast is grounded enough […]