What is the MACD indicator and what does it consist of
Open the chart for any cryptocurrency on an exchange or in TradingView, and you’ll almost certainly see the MACD among the built-in tools. It’s one of the most recognizable elements of technical analysis: it’s used by both beginners who are just getting started with crypto trading and professional fund managers. The reason is simple. The MACD indicator combines trend assessment with momentum assessment, meaning it answers two questions at once: where the market is heading and how strong that movement is. In this article, we’ll break down the definition and calculation formula, the main MACD signals, divergences, trading strategies, and common mistakes that cause traders to lose money on false crossovers.
MACD (Moving Average Convergence Divergence) is an indicator that measures the ratio of two exponential moving averages of price. In Russian-speaking circles, it is often simply referred to as “MACD.” The tool was developed by American analyst Gerald Appel in the late 1970s for the stock market, and since then, it has migrated—without significant changes—first to the forex market and then to digital asset trading.
To understand the logic behind the calculation, it’s important to recall how an exponential moving average differs from a simple moving average. A simple moving average (SMA) assigns equal weight to all prices over a given period. With the exponential moving average (EMA), the weighting is shifted toward the most recent price bars, so it reacts more quickly to recent price movements. The MACD indicator uses two EMAs with different periods, and their convergence or divergence reflects a change in momentum.
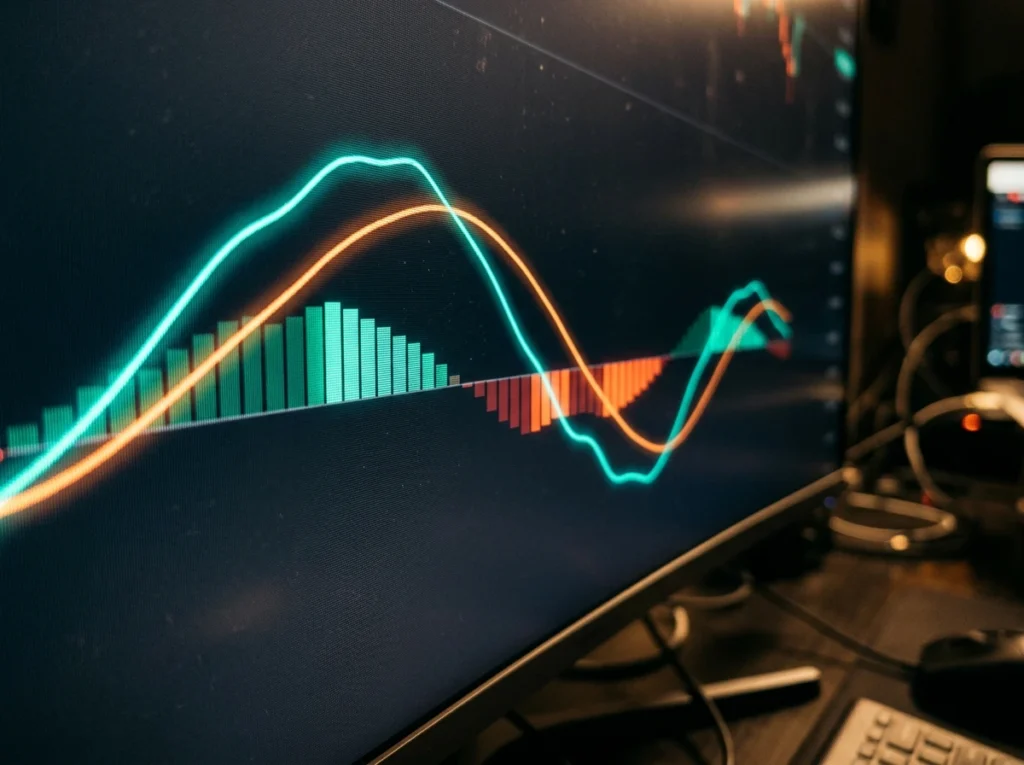
This classic technical indicator consists of four elements. The MACD line is calculated as the difference between the 12-period and 26-period moving averages. The formula is as follows: MACD = EMA(12) − EMA(26). The signal line is plotted above the MACD line: it is the 9-day EMA of the MACD line, that is, a smoothed version of the main curve. The MACD histogram shows the difference between the MACD line and the signal line: the higher the bars, the stronger the current momentum. The zero line marks the level at which EMA(12) and EMA(26) are equal, meaning that short-term and medium-term price trends coincide.
How to use the MACD indicator: visualization on a chart
The MACD is displayed not on top of the candlesticks, but in a separate window below the price chart. The MACD chart consists of two lines and a histogram centered around the zero line. When the fast EMA(12) moves upward away from the slow EMA(26), the MACD line rises, the histogram expands, and the market shows an acceleration in buying activity. The further apart the MACD line and the signal line are, the stronger the momentum. Conversely, when the curves converge, it signals that the movement is losing steam. This is how the MACD indicator works—it translates the distance between the moving averages into a visual representation below the price chart. The MACD allows you to assess both the direction and strength of the movement at once, which sets it apart from simple trend lines.
Bitcoin provides a clear example. By mid-July 2026, BTC is trading around $64,000, approximately 49% below its all-time high of $126,080, set in October 2025. Following such a protracted decline, the MACD line on the weekly chart is below the zero line: the EMA(12) is still below the EMA(26), and the indicator accurately signals a bearish phase, despite occasional rebounds. At the same time, the picture may be the opposite on shorter time frames, since each period calculates its own averages.
A separate question is why EMAs are used in the calculation rather than SMAs. The cryptocurrency market operates around the clock, without weekends or clearing breaks, and volatility here is significantly higher than in the stock market. A simple moving average takes too long to “process” sharp price movements, and the signal arrives with a significant delay. The EMA reacts faster, so this calculation method is better suited for digital assets.
Key MACD trading signals in cryptocurrency trading
MACD signals are typically divided into three groups: crossovers between the MACD line and the signal line, crossovers of the zero line, and histogram reversals. The basic trading signal—the first of these—is the crossover between the MACD line and the signal line. When the MACD line crosses the signal line from below, momentum shifts in favor of buyers, and traders consider taking long positions. If, on the other hand, the MACD crosses the signal line from top to bottom, this is a sell signal or, at the very least, a reason to reduce long positions. Context is more important than the fact itself: a MACD crossover above the zero line within an uptrend has historically proven more reliable than the same crossover deep in the negative zone.
The second group is related to the central axis. Whether the MACD line is above or below zero indicates the market phase: when the MACD is above zero, the short-term average is higher than the long-term average, and the bulls have the advantage. A MACD above zero with a rising histogram is a typical sign of a sustained uptrend. The moment the MACD line crosses the zero line is interpreted as confirmation of a trend reversal, although this occurs later than the price reversal itself.
The third type of signal comes from the histogram. The bars reverse direction before the curves cross, so a contraction in the histogram following a series of high values serves as an early warning of waning momentum. In the crypto market, scalpers often use this technique: declining bars on the four-hour chart frequently appear several candles before the actual crossover.
Divergences and their crucial role
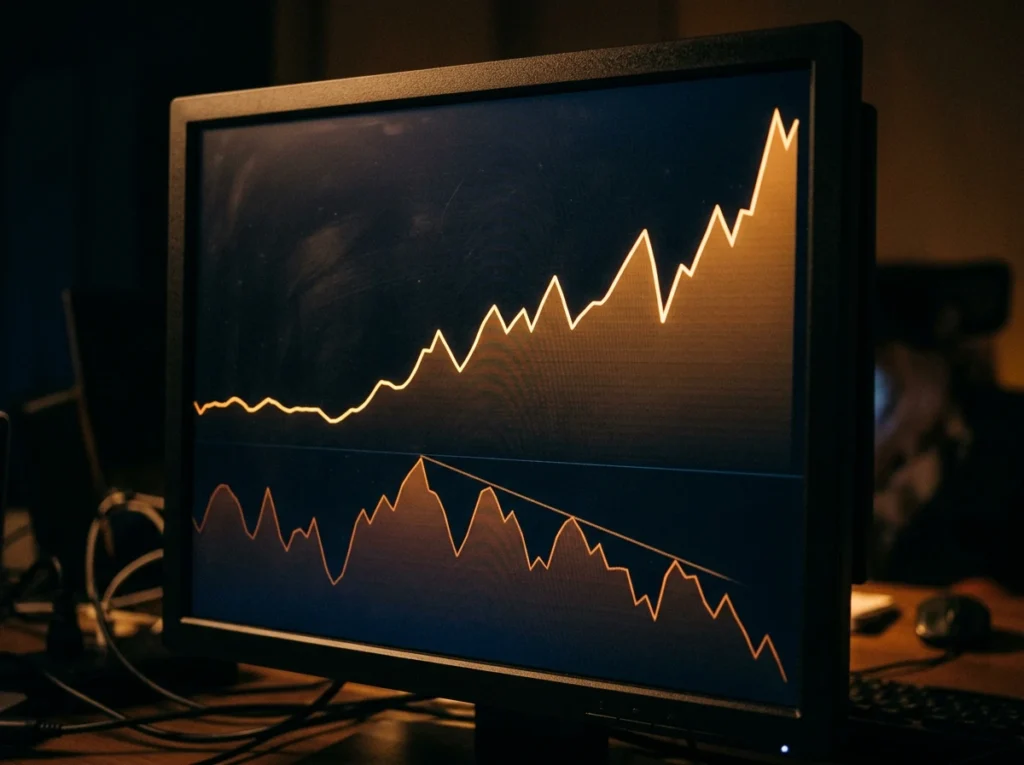
MACD divergence is a discrepancy between the price direction and the indicator direction. This signal is a must-have in the technical analysis. Bearish divergence occurs when the price makes new highs while the MACD forms lower peaks. This happens when buyers are pushing prices higher, but momentum is already decreasing.
Same pattern happened for Bitcoin in the fall of 2025, when the final surge to $126,080 was accompanied by lower highs in the oscillator. This was followed by a correction within several months. A bullish divergence is the mirror thing: the price hits a new low, while the indicator forms a low higher than the previous one, suggesting that selling pressure is decreasing.
It’s important to approach divergences with a level head. A divergence can drag on for weeks, especially it concerns higher time frames, and the price can move significantly during that time. That’s why experienced market participants don’t open a trade based only on a divergence. They wait for price confirmation instead: a breakout of a local level, a reversal candlestick pattern, or an increase in volume.
MACD settings and application in crypto
The default MACD settings are 12, 26, and 9. Appel selected these parameters for the six-day trading week of the last century, but they have also taken root in the 24/7 crypto market. You can adjust the parameters to suit your own trading style: intraday traders sometimes switch to a combination of 5, 35, and 5 to speed up the response, while long-term investors, on the other hand, smooth out the noise with values like 19, 39, and 9. Fine-tuning is justified only after testing on a specific coin’s historical data; otherwise, it becomes nothing more than an attempt to fit the data to a nice-looking backtest.
Using the MACD indicator in crypto trading has its own specific challenges. In cryptocurrency trading, volatility is higher, liquidity is unevenly distributed, and sharp squeezes can occur even with coins in the top ten. Therefore, the MACD indicator is rarely used on its own for cryptocurrencies. Combining the MACD with other indicators compensates for its weaknesses: the RSI identifies overbought and oversold zones, moving averages on the chart itself set the trading direction, and volume confirms interest from major players. It is recommended to use the MACD in combination with at least one filter, and pairing it with the RSI is the most common approach.
Trading strategies with MACD
The first and simplest strategy is based on curve crossovers. A trader buys when the fast line crosses the slow line from below, and closes the position on a reverse crossover. MACD helps identify momentum shifts in a timely manner; however, in its pure form, this approach is profitable only during trending periods, so it is supplemented with a higher-timeframe filter.
The second is the zero-line strategy which means that the trend filtering is based on the zero line. Buys are allowed only when the MACD line and the signal line are above zero; short sales are permitted in the opposite situation.
If the MACD line is below the central axis, any bullish crosses are ignored as counter-trend trades. This filter significantly reduces the number of trades but eliminates a substantial portion of unprofitable entries during sideways market conditions.
The third strategy combines divergence with price confirmation: divergence identifies a point of interest, and the entry occurs after a breakout of a local extreme. The fourth option is a combined approach. Traders use the MACD alongside the RSI and candlestick patterns: the oscillator identifies oversold conditions, a candlestick pattern such as an engulfing pattern provides the trigger, and a crossover on the MACD confirms the momentum reversal.
Limitations and risks of using MACD
One of the main drawbacks of MACD is its lag. Although MACD weights recent prices more heavily than older ones, it is still based on moving averages, so it only detects a reversal after it has already begun. In a calm sideways market, the problem is exacerbated: the MACD can generate a series of false signals when the MACD line and the signal line cross multiple times a day without any clear price movement. During such periods, the MACD becomes a source of losses rather than a helpful tool.
When using the MACD on one-minute charts, market noise outweighs useful signals, especially with illiquid altcoins, where a single large order can distort the entire picture. Using the MACD without risk management also leads to predictable results: without a stop-loss, even a statistically sound strategy cannot survive a series of unsuccessful crossovers. Finally, neither oscillators nor trend indicators account for news—listings, hacks, and regulatory decisions drive the crypto market more than any moving averages.
FAQ
MACD vs. RSI—what are the differences?
RSI is a momentum oscillator limited to a scale from 0 to 100; its purpose is to indicate overbought and oversold conditions. MACD serves a different purpose in cryptocurrency trading: it is trend-based and has no fixed boundaries. MACD also reflects the strength of the trend through its histogram, a feature RSI lacks. These tools do not compete with each other but complement one another, which is why they are so often placed side by side in screeners.
Why does MACD produce false signals?
The main reasons are sideways markets and low liquidity. In a sideways market, the moving averages run almost parallel, crossovers appear randomly, and it is impossible to distinguish a valid signal from noise. Technical analysis, in principle, operates on probabilities: the MACD functions as a statistical advantage, not a guarantee. To use the MACD correctly, you should filter entry points using a higher timeframe, the zero line, and volume, and simply ignore questionable crossovers.
Which timeframes are best for the MACD in crypto?
Daily and 4-hour charts provide the clearest signals with standard settings. Beginners will find it easier to use the MACD indicator on daily charts, where there is less noise and a single glance per day is sufficient. Scalping on M1 and M5 requires adjusted parameters and strict discipline, so it is not recommended for beginners.
To sum up: MACD can help determine the market phase, the strength of the momentum, and reversal points, while the smoothed curve—that is, the 9-day EMA of the MACD line—serves as a convenient trigger for entry points. You can’t predict the future using the MACD, but you can systematize your decisions. Use the MACD as part of a trading system that includes filters and risk management, test the settings on a specific cryptocurrency’s historical data, and then this tool—developed half a century ago—will work reliably on the Bitcoin chart as well.
Two rates of 10% per year can yield different returns, and the difference can sometimes become hundreds of dollars per position. It all comes down to the three letters before the percentage. APR and APY are being used at every turn in the cryptocurrency space: exchanges advertise APY rates on DeFi platforms, lending services display APR on loans, and the numbers next to these abbreviations look similar, even though they mean different things.
It’s important for investors to understand the difference between APR and APY, if only because platform marketers understand it perfectly well and always highlight whichever metric looks more attractive. So let’s break down what APR and APY are, provide the formulas, calculate examples using real numbers, and show where each metric is appropriate.
BONK experienced a hard fall in May 2026. The current price is around $0.000004594, about 92% below the ATH (all-time high) of $0.00005898 set on November 20, 2024. The token still attracts a lot of attention, mostly because it is at the center of Solana’s meme economy. So, which BONK price forecast is grounded enough […]
Over the past five years, new DAO experiments and models have flourished, garnering attention for their voting processes. If Web3 is to become a user-owned internet, DAOs will be the organisational fundamental through which that ownership is distributed. With over 13,000 active DAOs globally in 2026, up from just a few hundred in 2021, the space has matured considerably.

 Business