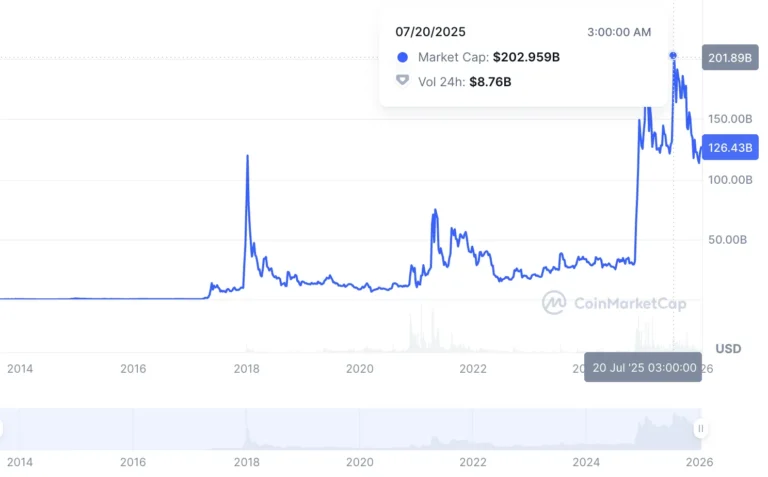
According to the latest data from CoinMarketCap, there are more than 30 million cryptocurrencies in the world, and as we can see from the chart, their number is growing exponentially.

11 min.
29.12.2025
Fibonacci in trading: how to build levels and trade using them
Fibonacci levels are a well-known and widely used technical analysis tool. However, not every trader knows how to use them correctly. Even experienced traders make serious mistakes when using Fibonacci levels. Some traders doubt that this indicator reflects the state of the market.
This is a typical chicken-and-egg question. Fibonacci ratios are used by many people, including professionals, to predict potential support and resistance levels. However, if you use this tool accurately and with knowledge, you can significantly improve your financial performance.
What are Fibonacci numbers — basic ratios (23.6%, 38.2%, 61.8%)
Fibonacci levels/numbers in trading are a tool that allows traders to track possible support and resistance levels for any asset. The name of the method comes from the famous numerical sequence of the same name, which is used to determine them: 0, 1, 1, 2, 3, 5, 8, 13, 21, 34, 55, 89, 144, … and so on to infinity.
To summarize, the Fibonacci golden ratio is when the ratio of the smaller part to the larger part is equal to the ratio of the larger part to the whole.
This sequence contains many mathematical functions that can be implemented in different areas of life, one of the key ones being trading.
This ratio is present in many areas of life/subjects, including the construction of a snail shell, Pascal’s triangle, the formation of elliptical galaxies, and the proportions of Leonardo da Vinci’s world-famous “Vitruvian Man.”
Moreover, when dividing each number by the number on the right, we will always get a coefficient of 68.1%. The main Fibonacci levels are 23.6%, 38.2%, 50%, 61.8%, and 100%. They are calculated by applying Fibonacci ratios to the previous price movement in the market.
The history of the Fibonacci method and its application in trading and finance
In the 12th century, Leonardo Fibonacci of Pisa identified a sequence that influenced many areas of life and simplified all mathematical calculations.
However, it took quite some time before this tool began to be used in trading. The first to use Fibonacci levels in trading was Charles Dow, the same man who invented the Dow Jones Industrial Average. He noticed a partial price correction after a movement in the main trend before it continued. His conclusion was that the breadth of the correction was between 33% and 66%.
Later, this theory was refined by Ralph Nelson Elliott. In the early 1930s, he began studying various stock index charts for the past 75 years. Based on this data, he created a wave analysis theory, which was based on Elliott’s observation that all indices move in waves, with a ratio of 1.618 also present. He introduced more accurate Fibonacci retracement levels: 38.2%, 61.8% (based on the Fibonacci sequence) and 50% (based on stock trends).
However, this theory does not answer the key question: which wave is the price in at a given point in time? It all depends on how to determine the starting point of the first Fibonacci wave in trading, on which traders and financiers still do not have a consensus.
How to build Fibonacci retracement levels on a chart — a step-by-step guide
Fibonacci retracement lines can be drawn on a cryptocurrency price chart to determine potential support and resistance levels for developing a further trading strategy. This can be done if you know the percentage ratios from the Fibonacci sequence.
Here are the main steps you need to follow to construct Fibonacci levels:
Select significant points: look at the chart and identify the maximum and minimum prices reached. An uptrend will start from the minimum point, and a downtrend will start from the maximum point.
Drawing the lines: draw a line from the starting point to the end point. After that, the tool you have chosen for trading will automatically determine and display the Fibonacci levels and the sequence of numbers in a given interval, after which you will be able to draw conclusions about price movements and so on.
Remember that each percentage level will be represented by a horizontal line on the chart. However, if you want to use these lines effectively, you should do so in conjunction with other analysis tools, including trend lines, indicators, and patterns.
It is worth remembering that this trend has its own additional peaks and troughs, so when using it, take into account the additional period restrictions:
For the M30 timeframe — no more than 10-12 days.
For the H1 timeframe — no more than 2-3 weeks.
For the H4 timeframe — no more than 6 months.
For the D1 timeframe — no more than 2 years.
For the W1 timeframe — up to 6 years.
For the MN timeframe — up to 12 years.
Let’s look at how to build a grid using a specific example.
An example of building and using Fibonacci levels on a chart:
Here is a simple, straightforward example of how to build a Fibonacci series (retracement) on a chart.
Example: upward movement (looking for pullbacks)
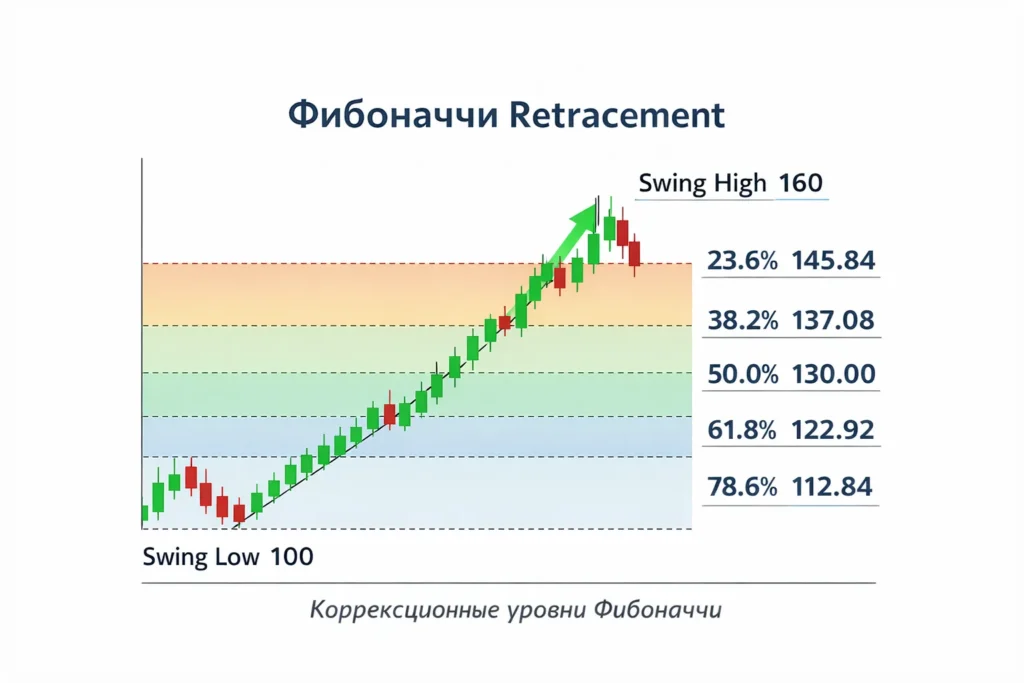
Let’s say the price rose from a low of 100 to a high of 160.
We find the swing low (local low) — 100
We find the swing high (local maximum) — 160
We take the Fibonacci Retracement tool and drag it from bottom to top: from 100 to 160.
Fibonacci chart 1
Next, we need the range of movement — this is the difference between the maximum and minimum.
In our case, the range is: 160 − 100 = 60.
How to calculate retracement levels
The logic is as follows: we calculate what part of the range (60) the price will “give back” and subtract this value from the maximum of 160.
| Level | How much is it from the range of 60 | Level price |
|---|---|---|
| 23.6% | 14.16 | 145.84 |
| 38.2% | 22.92 | 137.08 |
| 50% | 30.00 | 130.00 |
| 61.8% | 37.08 | 122.92 |
| 78.6% | 47.16 | 112.84 |
Meaning: after a sharp rise, the price often retraces, and these levels are used as indicators of possible support/interest (not a guarantee).
If the trend is downward (we are looking for upward retracements)
Here we do the opposite: we draw Fib from top to bottom — from the local maximum to the local minimum.
The idea is mirrored: we take the range of movement and calculate the retracement percentage, but now we add it to the low because the retracement is upward.
Example of extensions (targets) after a breakout
If the price has broken through the high (160 in the example above) and you want to estimate higher targets, use extensions.
Fibonacci chart 2
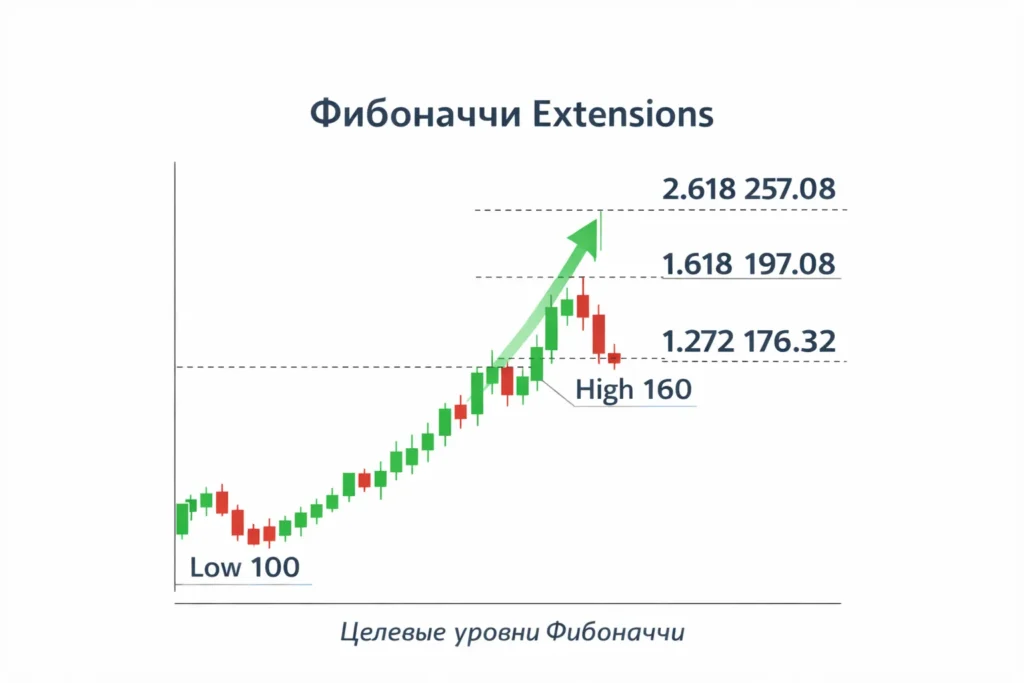
The logic is simple: the coefficients 1.272, 1.618, 2.618 mean that the price potentially passes 127.2%, 161.8%, 261.8% of the initial impulse. The same range (60) is taken as the base and plotted from the minimum (100).
For a minimum of 100, a maximum of 160, and a range of 60, the targets are:
1.272 → 176.32
1.618 → 197.08
2.618 → 257.08
A nuance that really matters: choose a rule in advance for how you mark swings — by wicks or by bodies/closes — and use it consistently every time.
Fibonacci correction — determining entry and exit points
To calculate entry and exit points using Fibonacci lines, you need to use the following formulas, which are familiar to all traders:
Fibonacci uptrend numbers = Maximum price — ((Maximum price — Minimum price) * percentage).
Downward trend recovery = Minimum price + ((Maximum price — Minimum price) * percentage).
Also, keep in mind that no trend can be smooth. There will always be rebounds and pauses, after which the price will continue to move or reverse. Such movements in trading are called corrections. In such cases, it is always worth waiting for the correction to end and only then opening a trade in the direction of the trend continuation.
Tips for finding entry and exit points
- It is worth opening a trade only after the price has crossed the Fibonacci level in the resumed movement. Do not open it immediately after the correction.
- Your profit target should be the next level. Don’t set yourself unattainable goals.
- Carefully monitor the movement: if, after the third reversal, the trend does not return to zero, be prepared for a possible change in the direction of the trend.
Popular strategies for trading using Fibonacci levels in trading — combined use with trend indicators

There are many strategies for trading with Fibonacci levels. Among them, there are several that have proven themselves particularly well among traders.
Trend trading on pullbacks
This type of trading using Fibonacci levels is quite risky, but it is an effective strategy that involves opening a trade immediately after a correction. Here you need to use the so-called Fibonacci levels — the points of the most likely price reversal at the end of the correction.
Trading on trend reversals
Carefully monitor the breakout of the key 61.8% level, which may signal a price reversal. Open a trade in the direction of this reversal.
Trading on channels
In this case, you are trading on Fibonacci channels — constructed on the extremes of resistance and support levels. These channels are not tied to a horizontal position. The trader always determines the angle of the channels independently.
Trading with extensions
Fibonacci extension levels in trading are based on Elliott’s wave theory, which we have already mentioned today. He was the first to notice the wave cyclicality of the market, which allowed him to identify patterns in price movement.
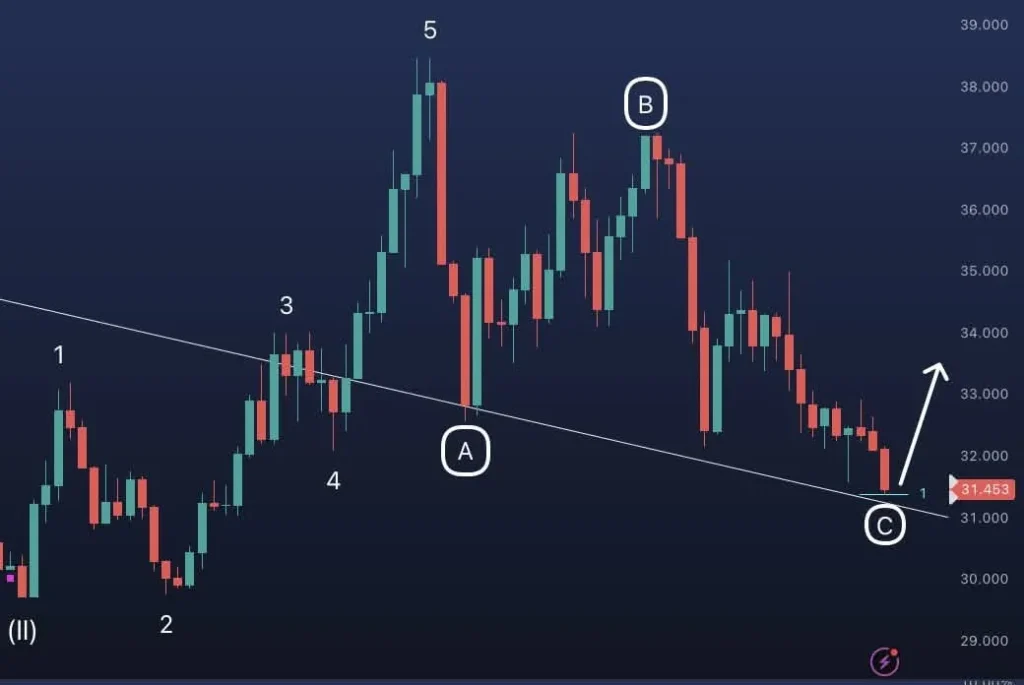
- Five waves (1–5) move in the direction of the main trend: three of them are impulsive, and two are corrective.
- Three waves (A–C) move in the opposite direction: two set a new, reversal trend direction, and one acts as a correction.
The Fibonacci grid itself predicts the length of Elliott’s third wave. As we already know, the end of the third wave occurs at the 161.8 mark, which may indicate a trend reversal according to the Fibonacci chart.
Advantages and limitations of the Fibonacci trading method
The main advantage of the Fibonacci correction method is its time-tested versatility, as the method itself was discovered a long time ago, and its effectiveness has been confirmed in various areas of life. It has been used in stock markets for over 50 years, and now also in the cryptocurrency market. Fibonacci levels will always be relevant as they can be implemented in any direction. Using this method, you can open new orders and quickly and successfully find entry and exit points.
The main disadvantage of this method is that you will need to be well prepared. Using Fibonacci levels means setting them manually, which may require certain skills.
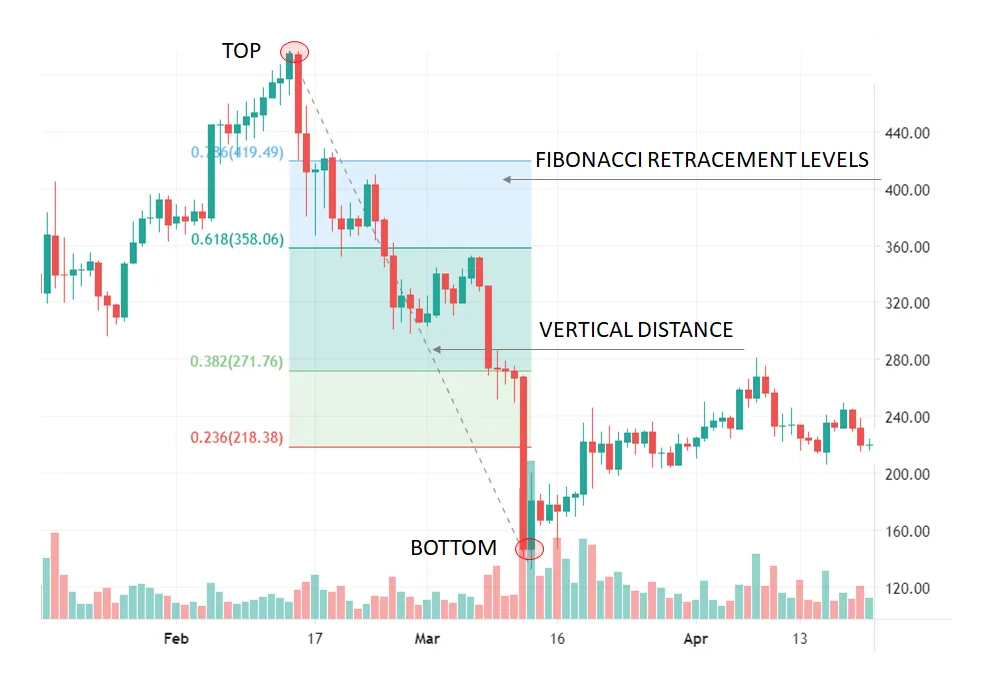
Examples on cryptocurrency charts — BTC, ETH
BTC example
Image 1 (BTC): you can see how, after a movement, the price rolls back and “reacts” near the levels of 0.236 / 0.382 / 0.618 (the levels are marked on the image itself).

Image 2 (BTC, TradingView guide): a training example where the emphasis is on the fact that many are waiting for a price reaction in the 0.5–0.618 range (often referred to as the “golden zone”).
ETH example
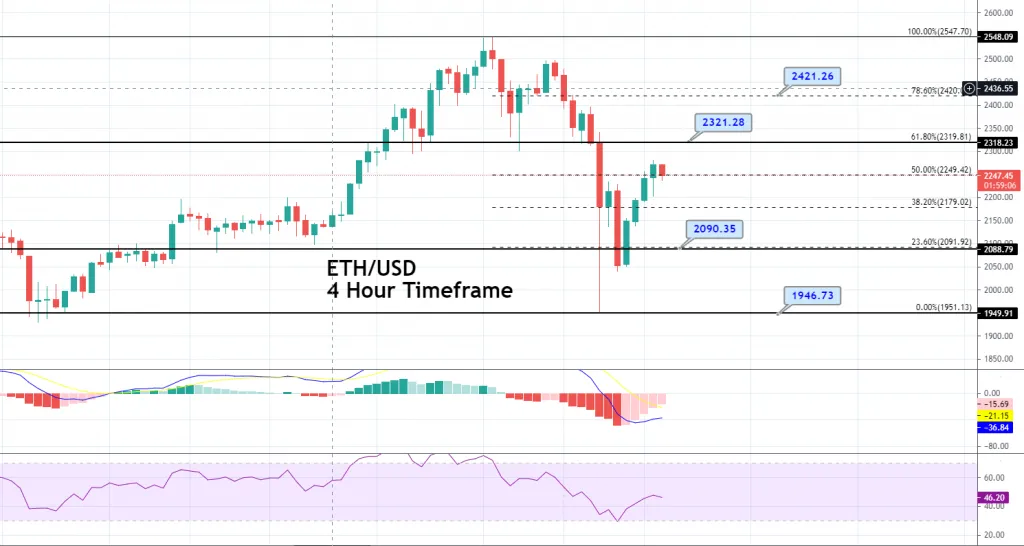
Image 3 (ETH, TradingView): an example where a touch/reaction at 38.2% (0.382) is noted.
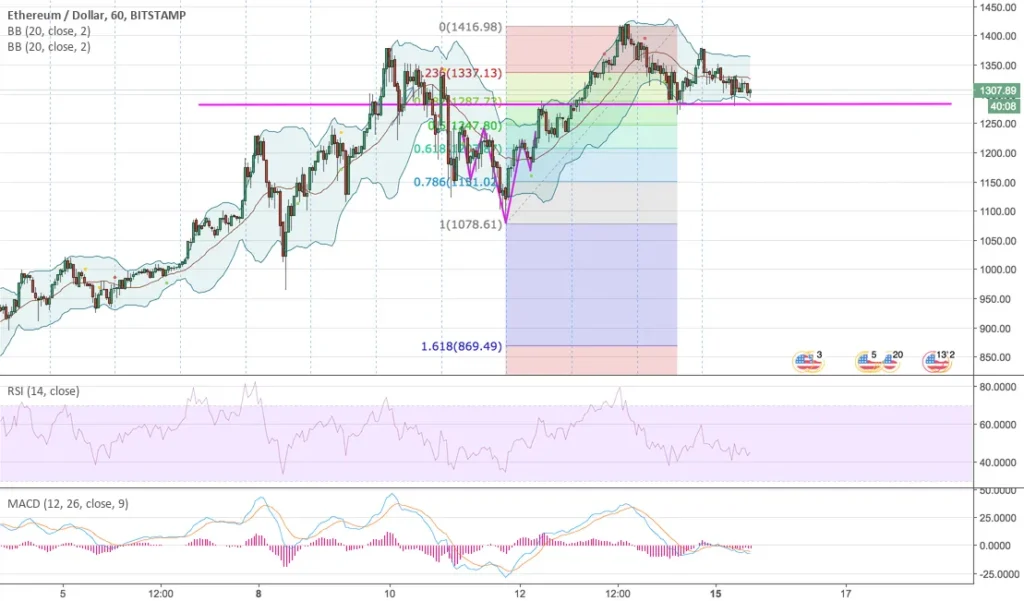
Image 4 (ETH): an example with a 50% level and a mention of the potential 61.8% zone as the next important level above.
Practical tips for traders
Fibonacci levels are a technical analysis tool, not magic. They are a convenient way to mark likely price reaction zones. Traders use the Fibonacci indicator in a trending market and after a clear impulse.
- First, select a “clean” swing: minimum→maximum in an uptrend or maximum→minimum in a downtrend. Do not drag the grid over noise within a flat.
- Consider the context of timeframes: levels with H4/D1 are usually stronger than with M15. It is good practice to build Fibonacci on the higher timeframe and refine the entry on the lower timeframe.
- Look for confluences: Fibonacci level + horizontal S/R + volume zone (POC/VA) + trend/MA. One level on its own is weak, but a combination is strong.
- The “golden zone” of 0.5–0.618 often gives the best setups, but don’t ignore 0.382 (strong trend) and 0.786 (deep pullback). Wait for confirmation: a reversal candle, a break of the local low/high, a retest.
- Plan your risk in advance: stop — behind the nearest swing (or behind 0.786/low), entry — limit/parts. Do not set the stop exactly at the level: leave “air” for volatility.
- For targets, use extension levels: 1.0, 1.272, 1.618, 2.0 — as take profit targets, especially after breaking through the previous high/low.
- Do not redraw Fibonacci every 5 minutes. Only rebuild after a new confirmed swing.
- Check the statistics on your instrument: where BTC/ETH bounces more often on the selected TF, and adjust your tactics to the actual frequency.
- On large cycles (weekly/monthly) in crypto, a logarithmic chart is sometimes more useful: this way, the levels better reflect percentage movements.
- After news and wicks, wait for stabilization first — Fibonacci on extreme wicks often gives false zones.
- The best trade is when the level coincides with the “market structure”: higher low/lower high and a clear scenario cancellation point. And remember: without discipline, Fibonacci will not save you.
Start your crypto exchange with Coin24

Exchange BTC, ETH, USDT and more — cash or card
Secure and fast crypto exchange since 2018
Buy or sell
100+
cryptocurrencies quickly and easily
Exchange crypto with cash or
card with Coin24
Exchange crypto
online
or in person in 50+ cities
Buy or sell cryptocurrency
via Privat24
Similar Articles

15.12.2025
Day trading (day trading) is intraday trading, when all positions on a selected asset are opened and closed within a single trading day. A day trader does not carry trades overnight: each trade lasts from a few minutes to several hours, and by the end of the trading day, the position is completely closed.
31.10.2025
Technical analysis offers a variety of patterns that assist traders in recognizing trend reversals or weakening trends in a timely manner. Seeing such a pattern in time and taking the right action is the key to success in any financial market, including cryptocurrency.