According to the latest data from CoinMarketCap, there are more than 30 million cryptocurrencies in the world, and as we can see from the chart, their number is growing exponentially.
10 min.
31.10.2025
Double Top in trading: downward trend reversal at the peak
Technical analysis offers a variety of patterns that assist traders in recognizing trend reversals or weakening trends in a timely manner. Seeing such a pattern in time and taking the right action is the key to success in any financial market, including cryptocurrency.
One of the most common and reliable signals in trading is the “double top.” In this pattern, prices reach a horizontal resistance level twice. It usually occurs after a prolonged upward movement and signals a trend reversal and a downward price reversal. In this article, we will look at what a “double top” is, how this pattern helps to spot a downtrend in time, and how to use a “double top” correctly to maximize profits.
What does the “double top” pattern mean in trading – description of the reversal pattern and its meaning
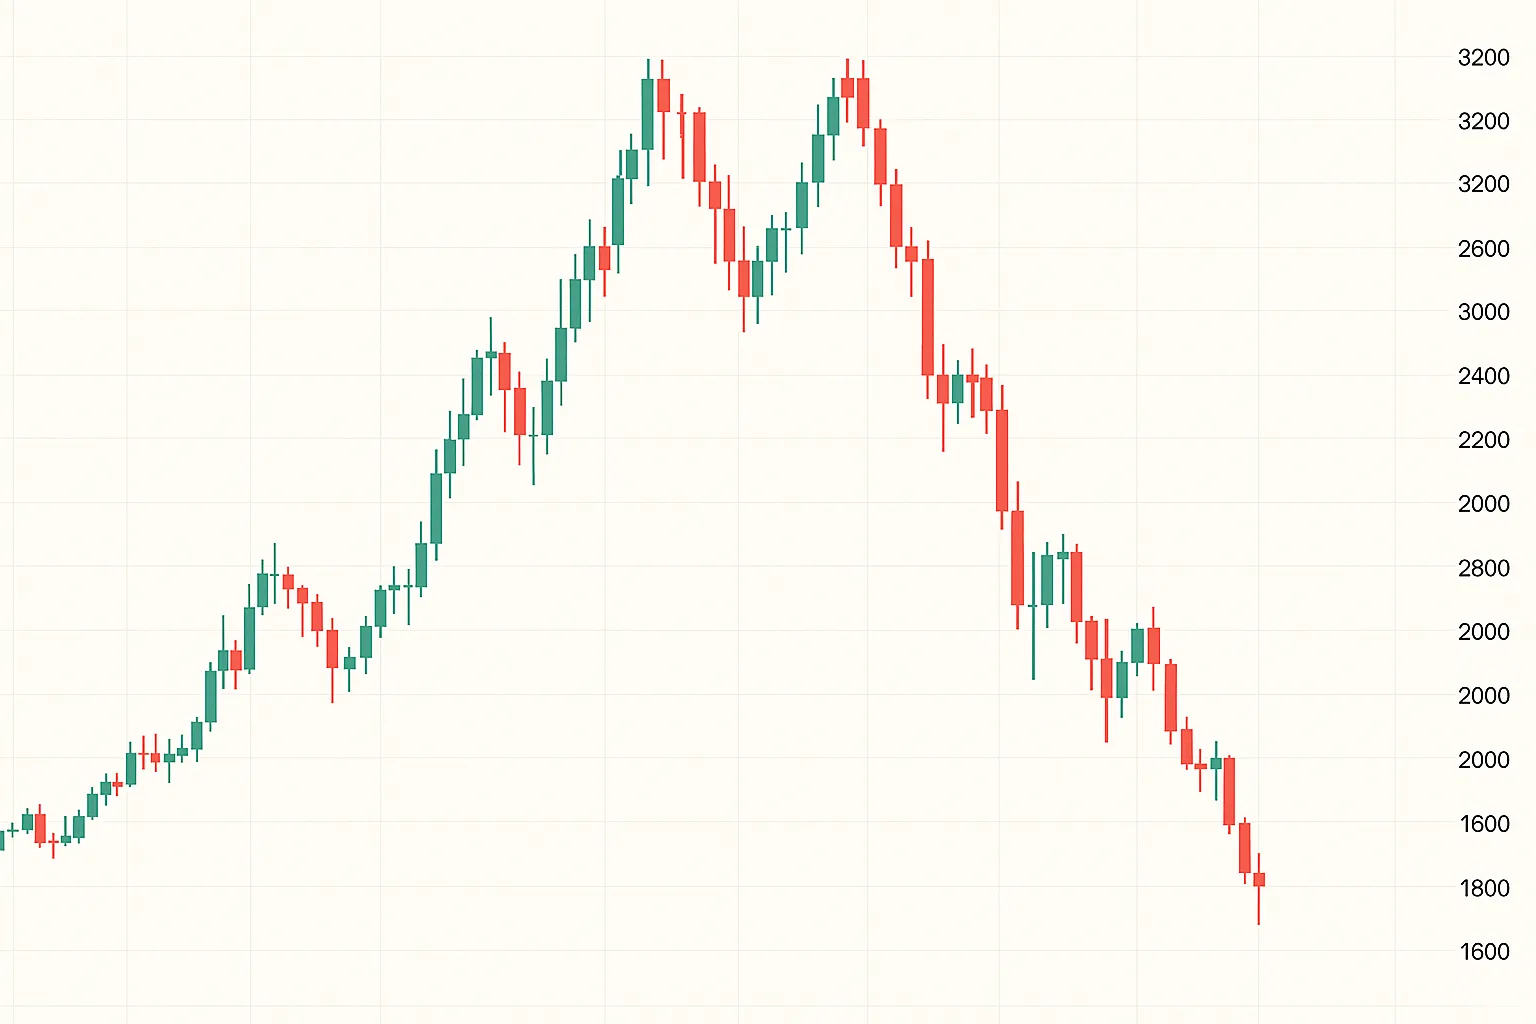
A “double top” is a classic bearish pattern, i.e., it signals a downward price movement. To notice this graphical model of an uptrend reversal, a trader should carefully monitor the chart.
The pattern itself resembles the letter “M” and shows that the price jumps twice to the resistance level. There is a small downward correction between the peaks, which forms the chart in the shape of the aforementioned letter. This pattern occurs in both short and long periods, which allows it to be used in different strategies.
If you see a “double top” pattern, it means that the asset is most likely significantly overvalued, as indicated by the uninterrupted price growth and two highs at the same resistance level.
If the price reaches the support line level, the downtrend will continue and intensify. If buyers hold the support line, the price goes up and, as a result, a “triple top” (“three mountains”) pattern is formed with the formation of a third price high. However, this pattern is much less common.
The opposite of a “double top” is a “double bottom” pattern, which warns of a possible reversal of the trend to an upward one. A “double top” and “double bottom” are formed when the price of an asset has been falling/rising for a long time and a trend change is imminent.
Stages of pattern formation – left shoulder, neck, confirmation

Each stage of pattern formation is very important and requires separate analysis, as understanding all the processes helps traders to set stop losses, take profits, and enter shorts in a timely manner.
The double top pattern occurs when, during an uptrend, the price rises to a strong resistance level for the second time but does not break through it. As a result, the price reverses and falls.
The main rule is that the larger the time interval on the chart, the stronger and more pronounced the bearish reversal will be.
How the “double top” pattern is formed in trading
There are 5 main stages in the formation of the “double top” pattern.
- Formation of the first peak: at the first stage, buying prevails in the market, so the price reaches a local maximum and then encounters resistance.
- Formation of a trough: at this stage, the price corrects to the nearest support level (the “neckline”). At this stage, market participants take profits, which is accompanied by a global decline in buyer interest.
- Formation of the second peak: the price again reaches the previous high as a result of the “bulls” pushing it up with new purchases.
- Final bearish price reversal: after the bulls break through resistance again, the bears take control and lower the price to the nearest support level.
- Breakthrough of the support zone: this is the final confirmation of the downtrend. Now the pattern is considered complete. The last stage signals to all traders a change from an uptrend to a downtrend. Now you can open short positions.
How to recognize a “double top” on cryptocurrency charts – time intervals, indicators, technical analysis

A “double top” is a fairly clear and visually recognizable pattern that is easy to spot on a chart. The main thing is not to confuse it with the “triple top” (“three mountains”) pattern.
The pattern itself, shaped like the letter “M,” consists of three key elements:
- first peak/first maximum
- neckline
- second peak/second maximum
In order to recognize in time that the market is about to turn down, especially if you are trading in the “medium term,” it is worth learning to notice the “double top” pattern in time. This is essentially a classic signal that the upward movement is beginning to run out of steam and the bears are gradually taking the initiative.
Here are a few guidelines to help you spot the emerging downward reversal pattern more often and more quickly:
The beginning – a confident upward trend
Before a “double top” appears, the price must go up – and not just grow, but do so steadily: each time, higher peaks and lows are reached. Often at this point, trading volumes also increase, confirming buyer activity.
The first peak
At some stage, growth slows down — the price reaches a local maximum. This is the first peak. Often, it is followed by a sharp but not critical downward pullback.
Minimum (first bottom, also known as the “neck”)
The price falls back to a certain point where it begins to stabilize. This level is often called the “neck line” — this is where the forces of buyers and sellers are roughly balanced. It is important to record this minimum because it will later become a reference point.
Second peak — but weaker
Buyers try to push the price up again — and this may look almost like a repeat of the previous maximum. But there is an important nuance here: the second peak usually does not reach the level of the first (although it can be different — the market is not always perfectly symmetrical). At the same time, trading volumes most often fall — this is a signal that the “bulls” are already losing momentum.
The key moment — breaking through the neckline
If, after the second peak, the price falls below the previous low, this is an alarm bell. It means that the support line has not withstood the pressure from sellers. When the price breaks through this “neckline” downwards, many traders see it as a signal: it’s time to open a short position or exit a long position.
Draw a neckline for visualization
To clearly understand where the “break” occurs, simply connect the two lows after the peaks with a horizontal line. This will be your support zone — watch how the price behaves near it.
A couple of final tips:
The “double top” pattern in trading is especially visible on 4-hour, daily, and weekly charts — that’s where it looks more reliable and confident. It’s also often found on charts of top cryptocurrencies like BTC, ETH, XRP, BNB, USDT and others.
Don’t forget that the formation of a “double top” is not a guarantee of a reversal, but only a probability. Therefore, confirming signals (volumes, candlestick patterns, RSI behavior, etc.) are still valid. The market likes to confuse you — your task is to learn to read its hints, not just obvious signals.
Trading strategy — entry after a breakout of the neckline, setting stops, patterns

The formation of a “double top” pattern allows you to open profitable short positions. Thanks to this pattern, you can calculate the entry points for a trade in advance and set clear stop-loss and take-profit levels.
When using this pattern, it is worth adhering to certain rules in your strategy.
- First of all, it is worth identifying the pattern itself, keeping in mind that it is formed at the top of an uptrend.
- It is also better to wait until two peaks are formed and there is a final price reversal, and only then mark the resistance level. Remember that the peaks should be located at approximately the same level.
- Always wait for the moment when the price falls below the neckline, confirming the reversal pattern and marking the trend reversal. Then you can confidently open a short position or a sell position.
- To reduce risk, consider placing a stop loss above the last swing high. To determine the profit target, you need to project the vertical distance between the neckline and the highest peak down from the neckline.
- After breaking through the neckline, the price may retest it from below. Wait for the price to break down, retest, and then find confirmation of the bearish trend. Only then should you open a short position.
- Set your profit target by projecting the height of the pattern downwards or finding likely support levels. Place a stop loss above the last swing high.
- Increase the reliability of the double top by using technical indicators such as MACD or RSI. Check for bearish divergence when the indicators show lower highs as price highs are formed. Open a short position after the neckline is broken.
Examples of successful trades – BTC, ETH, and others
BTC
A classic “double top” formed on the daily Bitcoin chart in May–June 2024. The first peak was around $71,958 (May 2024), the second was around $71,629 (June 2024), and the “neckline” was around $66,343.
Trade: if support at $66,343 is broken, a short entry is recommended, with a target of approximately $60,728 (calculated based on the size of the figure, a difference of $5,615).
In fact, after the breakout, the price fell even further – by July 5, BTC had dropped approximately $12,793 below the $66,343 level (i.e., to ≈$53,550). This corresponds to a potential profit of about 8.5% at the initial target and about 19% from the entry level to the bottom of the movement.
ETH
The monthly chart for Ethereum at the beginning of 2025 showed a bearish “double top” pattern. According to analyst Nebraskangooner, the pattern emerged after a prolonged decline, and it is assumed that a break below the lower line of the pattern (~$2,282) will lead to a price drop to the support level of ≈$1,200.
Short entry – upon a confident breakout of the upper boundary of the support zone (around $2,200–$2,300), target – $1,200. In this case, a drop from ~$2,282 to ~$1,200 gives an approximate 47% price decline (and, accordingly, a profit on the trade).
SOL
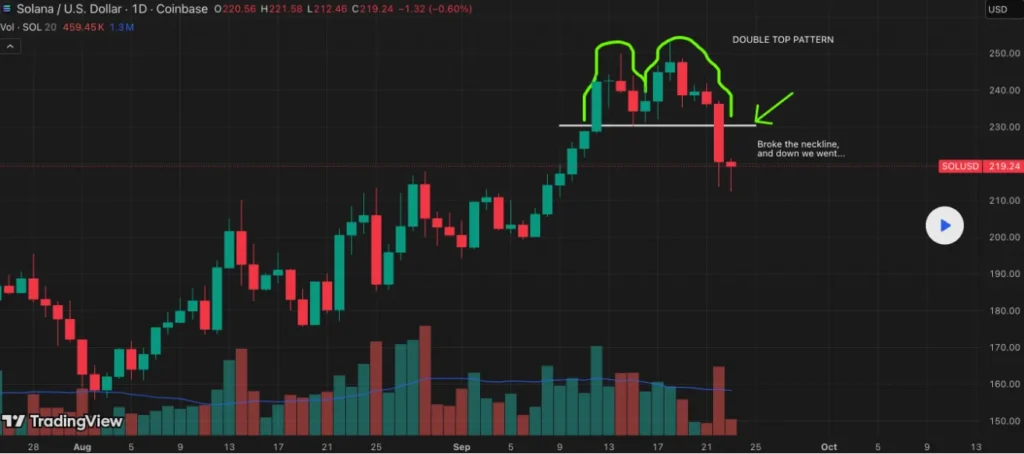
A double top pattern on the Solana daily chart in the summer of 2025: the first peak was $206 on July 21, 2025, and the second was $209 on August 14, 2025.
The neckline is around $183; if it is broken, analysts predicted a pullback to ~$175 at first, and then to ~$161 if selling continues.
Trade: short entry at $183, exit at around $161. Thus, from $183 to $161, the potential return is about 12%.
Risks and false signals – how to minimize them
The double top pattern, like any other pattern, has certain limitations in its use. When this trend forms, there are often bearish and bullish traps that both novice and experienced traders often fall into. After such mistakes, positions may be automatically closed, which can trigger an unexpected price reversal.
That is why it is important to carefully monitor that all stages of chart construction are followed without exception.
When trading the double top pattern, it is important to remember the rules of risk management and spend no more than 2% of your total deposit on a single position.
Always confirm the double top pattern with candlestick charts and indicators (MACD, RSI, and others). This will allow you to use this pattern most accurately in trading, assess the market situation, predict price movements more clearly, and minimize risks.
____________________________________________________________
If you have little trading experience, it is worth starting with a demo account and practicing regularly in test mode. This will allow you to work out different trading strategies, learn to identify the main stages of the double top pattern, and use the knowledge you gain to make successful and profitable trades.
Start your crypto exchange with Coin24

Exchange BTC, ETH, USDT and more — cash or card
Secure and fast crypto exchange since 2018
Buy or sell
100+
cryptocurrencies quickly and easily
Exchange crypto with cash or
card with Coin24
Exchange crypto
online
or in person in 50+ cities
Buy or sell cryptocurrency
via Privat24
Similar Articles

29.12.2025
Fibonacci levels are a well-known and widely used technical analysis tool. However, not every trader knows how to use them correctly. Even experienced traders make serious mistakes when using Fibonacci levels. Some traders doubt that this indicator reflects the state of the market.

15.12.2025
Day trading (day trading) is intraday trading, when all positions on a selected asset are opened and closed within a single trading day. A day trader does not carry trades overnight: each trade lasts from a few minutes to several hours, and by the end of the trading day, the position is completely closed.