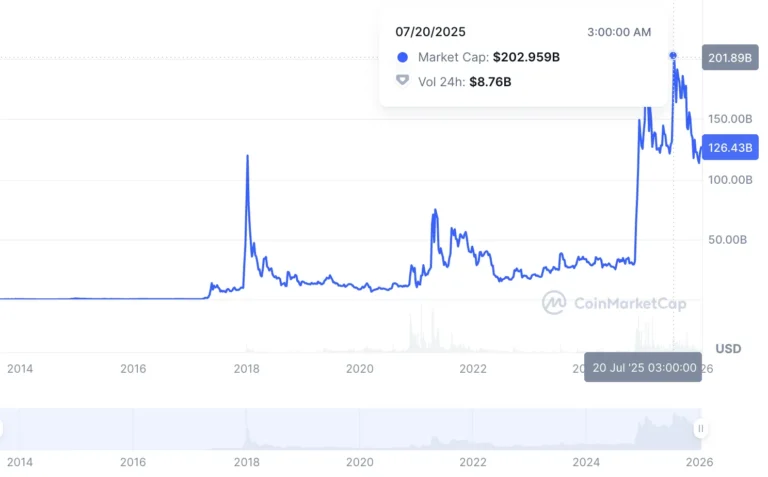
According to the latest data from CoinMarketCap, there are more than 30 million cryptocurrencies in the world, and as we can see from the chart, their number is growing exponentially.
12 min.
23.10.2025
The inverted head and shoulders pattern in trading – how this figure helps to recognize a trend reversal
Head and shoulders are super popular terms in trading, used by traders as often as chefs use “al dente” and “sous vide.”
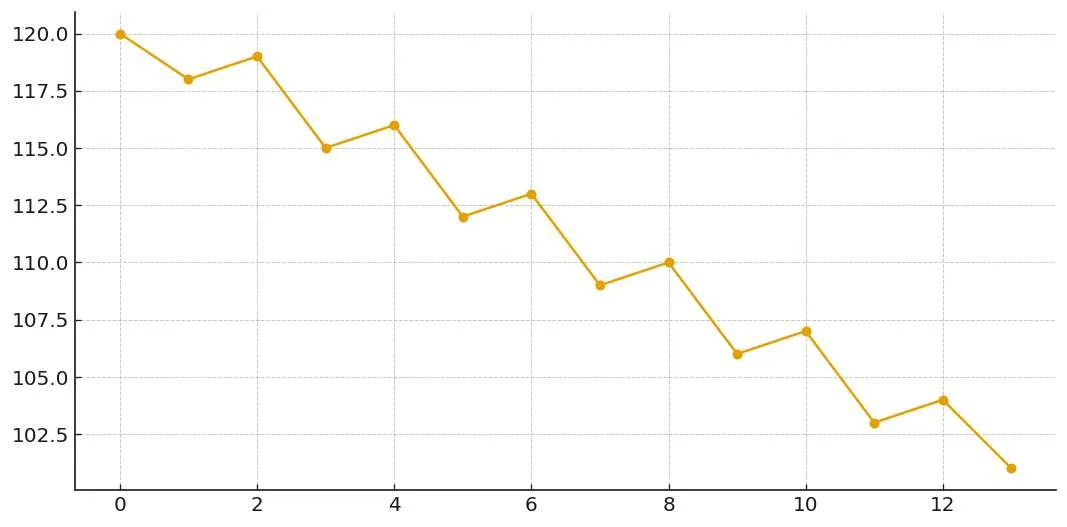
The head and shoulders pattern was first discovered by Charles Dow in the early 20th century. He also developed the entire subsequent theory of trends. One of his main theories, which many traders still use today, is that a strong trend is characterized by a gradual increase/decrease in local lows and highs. For example, if the trend is upward, each high will be higher than the previous one, and the low will be lower.
Let’s take a closer look at what patterns such as the head and shoulders figure mean in the context of crypto trading.
The significance of reversal patterns in crypto trading
Graphical trend reversal patterns play a key role in the technical analysis of cryptocurrencies. The head and shoulders pattern signals that the current trend is weakening and may soon be replaced by the opposite (bullish to bearish or vice versa). One of the most reliable and popular reversal patterns is the head and shoulders pattern. This pattern can indicate a possible reversal of both a downward (bearish) and upward (bullish) trend with varying degrees of accuracy. Thanks to clear entry and exit signals, this pattern is successfully used by both novice traders and experienced investors.
In the cryptocurrency market, known for its volatility, timely recognition of a reversal pattern by a buyer is especially valuable. When the price moves in one direction for a long time, reversal patterns such as head and shoulders allow traders to notice the weakening of the trend in time and prepare for a trend reversal. For example, the classic head and shoulders pattern at the top of an uptrend warns of an imminent price correction. Its mirror image at the bottom of a downtrend signals a possible market shift to growth. By correctly identifying such a pattern, a crypto trader can adjust their strategy in advance.
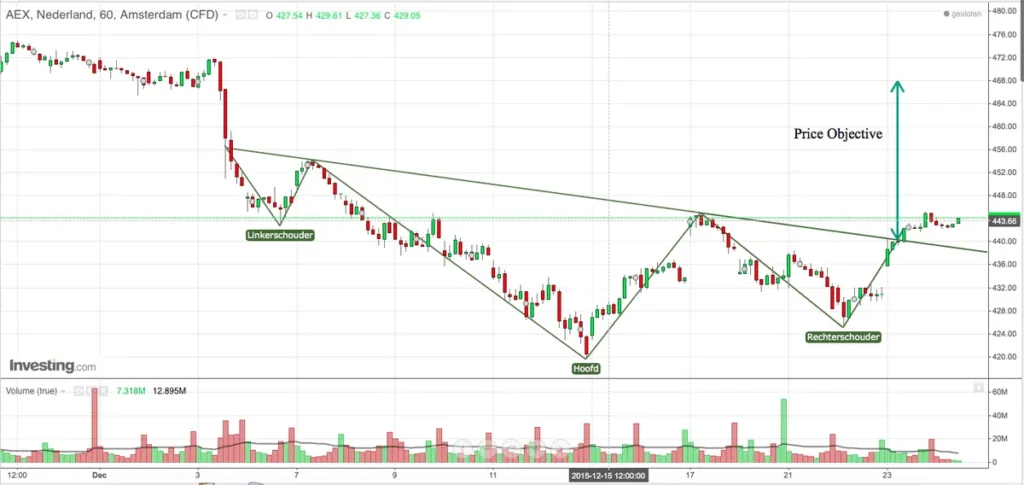
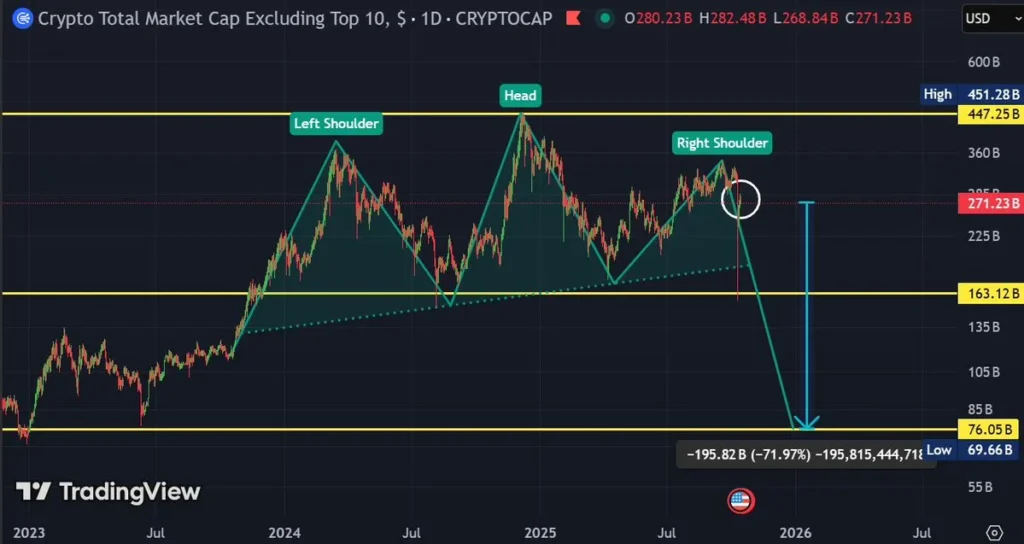
What is a “head and shoulders” pattern and its inverted variant in trading – diagram, formation
The “head and shoulders” pattern is a classic technical analysis chart pattern that resembles a human head and two shoulders. This pattern is formed from three consecutive price extremes: two peaks of approximately equal height at the edges (the so-called shoulders) and the highest peak between them (the head). The unusual name reflects the visual similarity of the figure to the outline of a head and shoulders on a chart. The neckline, an important element of the pattern, is drawn through the two troughs between the three peaks and serves as a support level (for the classic version) or a resistance level (for the inverted version). A breakout of this line usually confirms the completion of the head and shoulders pattern and a definitive trend reversal.
The inverted head and shoulders (also known as “head and shoulders down”) is a mirror image of the classic pattern. This bullish (optimistic) version of the pattern occurs at the bottom of a prolonged downtrend. In other words, before an inverted pattern can form, the market must go through a phase of significant price decline—only then is there “room” for an upward reversal. The inverted pattern includes three consecutive lows (troughs) instead of peaks. The middle trough, which is the deepest, plays the role of the “head,” while the two smaller troughs on either side are the “shoulders.”
How to recognize an inverted head and shoulders pattern on a chart – key signals, example
Recognizing a head and shoulders pattern requires careful observation of the structure of price lows on the chart. Here are the main signals that a trader should pay attention to:
A preceding downtrend. “For a reversal, there must be something to reverse” — if there has been no prolonged downward movement, then a cluster of troughs resembling an inverted head and shoulders pattern is most likely accidental and does not indicate a trend reversal.
Three troughs forming a familiar shape. Ideally, the price forms a series of three lows: first a local low (potential left shoulder), then a deeper low (head), and then a third low higher than the previous one (right shoulder). These points create the recognizable silhouette of an inverted “head and shoulders.” It is important that the head is significantly lower than the two “shoulders,” otherwise the pattern is not clear.
Neckline and resistance level. Simultaneously with the formation of depressions, it is necessary to note the neckline — draw a line on the chart through the local price highs between the head and shoulders. In an inverted pattern, this line acts as a resistance level, holding back price recovery.
Trading volume (additional signal). Experienced traders pay attention to volume dynamics during the formation and breakout of the pattern. Often, during the formation of the left shoulder, the volume decreases, a surge in sales (panic selling) can be observed during the fall to the head, and during the formation of the right shoulder, the volume is already lower, indicating a decline in selling pressure.
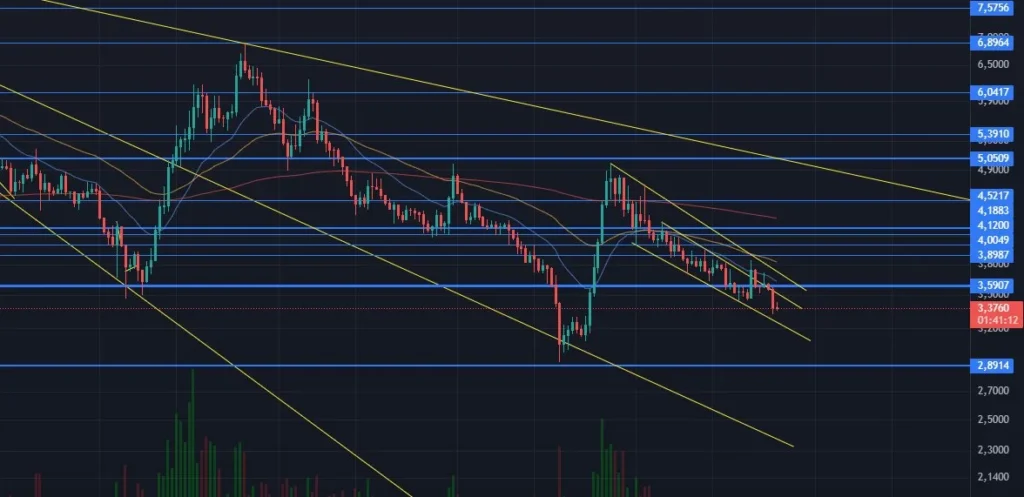
Let’s look at a real example. In February 2024, a distinct head and shoulders pattern formed on the 4-hour Solana chart, pointing downward. First, from February 14 to 23, there was a sharp downward trend — the price of Solana fell by about 15.5%. This was followed by an upward rebound on February 22, which formed the “left shoulder” of the pattern. After that, the market fell again by about 8%, reaching a new low — this was the “head” of the pattern.
On February 24, there was another upward rebound, followed by a slight decline (~4%), which completed the formation of the right shoulder. Thus, by the end of February, the three troughs had formed a characteristic shape, and an inverted pattern became apparent. The critical moment came on February 26, when Solana’s quotes confidently broke through the neckline of the pattern upwards — immediately after that, over the next three days, the price rose rapidly by about 33%. This example clearly demonstrates how the “head and shoulders” pattern serves as a harbinger of a bullish reversal: recognizing the pattern and noticing the breakout of resistance (the neckline), traders received a signal to enter long positions, which triggered a sharp rise in price.
Long in crypto: what it is, the meaning and risks
The “head and shoulders down” pattern is valuable to traders because it helps them open a long position — a position to buy an asset — at the right time, when a new uptrend is emerging. Before moving on to the trading strategy for this pattern, let’s clarify what is meant by a long position in crypto trading.
Long in trading – (long position)
A long is the purchase of an asset (e.g., cryptocurrency) with the expectation that its price will rise. A trader who opens a long position hopes to sell the purchased asset later at a higher price and thus make a profit. The amount of potential profit directly depends on the scale of the subsequent increase in the value of the asset. Simply put, opening a long position means betting on market growth: buying cheap now to sell high later.
In the context of cryptocurrencies, the most common way to go long is to simply buy a coin on the spot market and hold it in anticipation of a price increase. This strategy is popular with retail investors and is considered simpler and less risky than short positions. However, there are also credit or margin longs, where a trader borrows funds against collateral to increase the volume of the purchase. Margin trading allows you to increase your profits when prices rise, but it also significantly increases the risks: if the market moves against your position, your losses will also increase.
Trading strategy — entering a trade, stop loss, take profit
Once you have identified a reversal pattern, an inverted head and shoulders pattern, on the chart, it is important to correctly implement this signal in a trade. Below is a step-by-step description of the trading strategy for this pattern:
- Wait for the head and shoulders pattern to form and for the reversal to be confirmed. First of all, do not enter the market until the pattern is complete. Patience is required: wait until the right shoulder has finished forming and the price is close to the neckline. Under no circumstances should you buy in advance, “hoping” that the shoulder will be completed — the market may not go above the level, but in a different direction. The correct approach is to wait for a breakout of the neckline.
- Opening a long position (going long). The signal to buy is when the price breaks above the neckline of the inverted pattern on the chart. As soon as the market shows that it is capable of overcoming resistance and an inverted pattern becomes apparent, you can open a long position.
- Setting a stop-loss order. An integral part of the head and shoulders strategy in trading is to limit possible losses in advance. When trading an inverted head and shoulders pattern, a stop loss is usually placed just below the minimum price level formed by the head pattern. That is, in fact, the stop is placed at the very bottom of the pattern — the point where the absolute minimum (the bottom of the head) was reached. In general, the recommendation of experts is simple: always use a stop loss when trading the head and shoulders pattern, as false price breakouts sometimes occur.
- Determining the target profit level (take profit). The classic way to calculate the target movement for an inverted head and shoulders pattern is to measure the vertical distance from the head to the neckline. In the inverted version, the difference in price between the lowest point (head) and the neckline above it is taken. Suppose this difference is X (for example, $10, or 10% of the price) — then, after the neckline is broken, the bullish target is predicted to be at least X above the neckline. Simply put, the peak of the figure is postponed upward from the breakout point. It is at this level that many traders place take-profit orders to lock in profits.
- Position management and exit. After opening a long position, trading does not end – it is important to manage the position competently. If the price is moving steadily upward, you can gradually move the stop loss behind it (trailing stop) or fix the profit in stages.
Common mistakes made by traders
Although the head and shoulders pattern is deservedly considered one of the most reliable reversal signals, in practice, novice traders can make a number of mistakes in interpreting it and trading on it.
Premature recognition of the entry point into a trade. Since the buyer’s brain tends to look for familiar images, a trader may “see” the outlines of the head and shoulders where they do not exist, or when the pattern is not yet complete. As a result, positions are opened too early — before the neckline is broken or even before the right shoulder is formed.
Ignoring false signals and lack of confirmation. Sometimes the price seems to have formed candlestick patterns, but before reaching the target, it resumes its decline (for an inverted case) or growth (for a normal case). Or the neckline is broken, but it turns out to be a trap: the market only briefly jumped above the level and then returned back under resistance – a so-called false breakout.
Waiting for ideal conditions. The opposite situation is when a trader takes the textbook description too literally and expects the market to be a perfect picture. In real life, however, a “classic example” with a straight neckline and symmetrical shoulders is practically unheard of. Trying to trade only perfectly symmetrical figures is a mistake, as you may never see them.
Relying on only one pattern. Another mistake is to ignore other aspects of analysis, becoming “blinded” by the obvious head and shoulders pattern. Yes, the pattern is considered reliable, but the market remains unpredictable. No indicator or pattern can guarantee 100% profitable trades.
Incorrect position management. Common problems include moving the stop loss “further away” in the hope that the market will reverse (exacerbating the loss), prematurely closing the position at the slightest pullback (lost profit), or, conversely, not fixing the profit at the target, hoping for endless growth (the market reverses and profits melt away).
In general, experience and discipline are required to avoid these mistakes. It is recommended to first “rehearse” pattern recognition and trading based on it using historical data or a demo account.
Practical recommendations
Wait for clear confirmation of the pattern. Ideally, the breakout should be accompanied by an increase in trading volume, which is a sign of the strength of the new trend. It is also useful to wait for the daily (or 4-hour, depending on your timeframe) candle to close above the neckline to make sure that the momentum is stable.
Use a comprehensive approach. Despite its high reliability, the head and shoulders pattern should be used in combination with other technical analysis tools. Analyzing several factors will increase the accuracy of the forecast and confidence in the decision made.
Manage risks and capital. Always set a stop loss level for a trade (for example, below the head of the pattern) and a position size in accordance with your risk management. It is not recommended to risk more than 1-2% of your capital in a single trade.
Be prepared for different scenarios. Write down an action plan in advance: what you will do if the price goes in the wrong direction after entry, and what you will do if the target is reached. Consider a more positive development — what if the bearish trend turns out to be very strong and exceeds expectations? For example, you can leave a small part of the position even after taking profit and accompany it with a trailing stop to earn more.
Analyze the results and learn from experience. Over time, you will accumulate statistics: on which coins and timeframes the inverse head and shoulders pattern works most often, and in which market conditions (for example, at the end of a bear market or during local corrections).
Start your crypto exchange with Coin24

Exchange BTC, ETH, USDT and more — cash or card
Secure and fast crypto exchange since 2018
Buy or sell
100+
cryptocurrencies quickly and easily
Exchange crypto with cash or
card with Coin24
Exchange crypto
online
or in person in 50+ cities
Buy or sell cryptocurrency
via Privat24
Similar Articles

29.12.2025
Fibonacci levels are a well-known and widely used technical analysis tool. However, not every trader knows how to use them correctly. Even experienced traders make serious mistakes when using Fibonacci levels. Some traders doubt that this indicator reflects the state of the market.

15.12.2025
Day trading (day trading) is intraday trading, when all positions on a selected asset are opened and closed within a single trading day. A day trader does not carry trades overnight: each trade lasts from a few minutes to several hours, and by the end of the trading day, the position is completely closed.